
Although we mention that this tutorial works for both PowerPoint 2007 and 2010, the actual techniques work only within PowerPoint 2010 for Windows. The reason why this does not work well within PowerPoint 2007 is because that version had no option for pattern fills. However, if you work within PowerPoint 2010 using the procedure outlined on this page, you’ll find that any changes you make show up in PowerPoint 2007 as well.

Related Posts
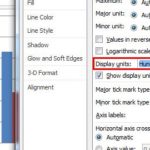 In your chart, Axis Labels are the labels for the Categories and Values on chart axes. So where do these labels come from? Category axis labels reflec...
 While learning about chart axes, you will come across two terms, Major and Minor units. These are the intervals at which the axis spaces itself -- as ...
 Charts are a visual representation of data, and when seen on a PowerPoint slide from afar, you make out the value of a series by exploring where exact...
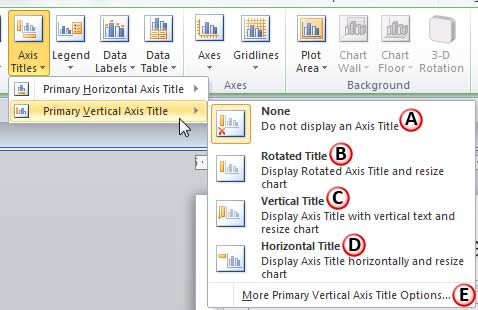 In a chart, the text used to label the chart axis is called Axis Title. All chart types other than Pie and Doughnut have axes -- and although Radar ch...