 (No Ratings Yet)
Typically, the Plot Area sports no fill attributes, and thus shows the slide’s background. You can apply any fill to your chart’s Plot Area. The reason why you would like to do that is to highlight the Data Series and Gridlines that populate your chart’s Plot Area, especially if you have a busy slide background. In this tutorial, let us learn how to apply a solid fill to the chart’s Plot Area in PowerPoint 2013.

Learn how to apply solid fills to the Plot Area of a chart in PowerPoint 2013 for Windows.
Related Posts
 Patterns in PowerPoint are two-color designs comprising lines, dots, dashes and checks. PowerPoint includes 48 patterns such patterns with names like ...
 The Plot Area of a chart, which is transparent by default, can be enhanced with various fill types. But you should exercise some caution -- a busy Plo...
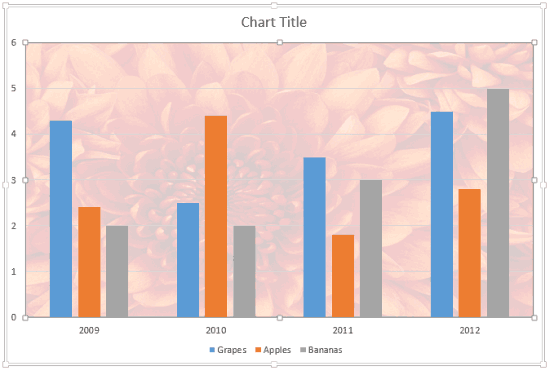 Picture fills can look great and distracting depending upon the type of picture you chose -- and the object that you fill with the picture can also ma...
 Gradient fills are typically blended fills between two or more colors that graduate from one color to another -- and if you use neutral or muted color...