 (No Ratings Yet)
In a chart, the Plot Area is the backdrop upon which other chart elements such as Data Series and Gridlines are placed. This layer has axes on its perimeter. By default, the Plot Area has no fill attributes, and is transparent. This may look plain, and that by itself is no reason to change the fill of the Plot Area. However, there are times when the slide background itself is busy — and adding a different fill to the Plot Area can then make the chart appear more clear.

Learn how to apply fills to the Plot Area of a chart in PowerPoint 2013 for Windows.
Related Posts
 Patterns in PowerPoint are two-color designs comprising lines, dots, dashes and checks. PowerPoint includes 48 patterns such patterns with names like ...
 The Plot Area of a chart, which is transparent by default, can be enhanced with various fill types. But you should exercise some caution -- a busy Plo...
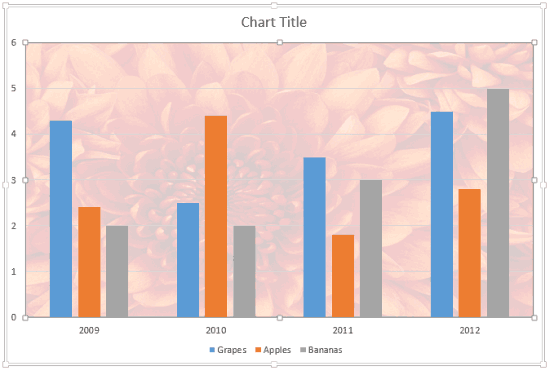 Picture fills can look great and distracting depending upon the type of picture you chose -- and the object that you fill with the picture can also ma...
 Gradient fills are typically blended fills between two or more colors that graduate from one color to another -- and if you use neutral or muted color...