 (3 votes, average: 5.00 out of 5)
PowerPoint provides sample choices in chart types for almost every kind of graphical data representation. There are some basic chart types such as column, bar, line, pie, etc., and advanced charts like radar, surface, bubble, doughnut, etc. Together, all these chart types cater for almost every kind of graphical data representation.

Learn to change the chart type from one to another in PowerPoint 2003 and 2002 for Windows.
Related Posts
 Have you seen charts that were not filled with solid color fills or geometric patterns, but rather with pictures? For instance, if you wanted to show ...
-
Working with charts in PowerPoint involves a deep knowledge -- hidden beneath the surface are umpteen options that many PowerPoint users are simply no...
-
You can create the most amazing charts without any text since the main purpose of any chart is to show a trend. Having said that, text plays a very im...
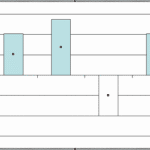 In an ideal world, we would like to have charts that had all positive values. Yet, sometimes, growth rates may plummet, and you might end up seeing ne...