 (2 votes, average: 5.00 out of 5)
Did you happen to see a chart that spoke of fruit exports, and each column of the chart was filled with pictures of a particular fruit type rather than the conventional solid color fills or geometric patterns. For instance, if you wanted to show how the export of grapes has increased over the years, your column chart would have all columns filled with pictures of grapes stacked one over the other.

Learn to use a picture as a fill for your chart series within PowerPoint 2007 for Windows.
Related Posts
 Although PowerPoint enables you to edit the fill, lines, and effects attributes of a shape, this is a time consuming task that may involve trying out ...
-
You have already learned how to add different fills for shapes in PowerPoint 2007. As you have seen in those shape fill tutorials, the Shape Fill gall...
 The significance of any chart lies in its ability to visually represent complex data as a trend that an audience can easily grasp. So, if you create a...
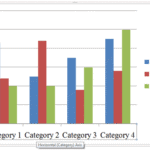 Although charts are a visual medium, they still contain plenty of text in the form of data labels, titles, legend, axis labels, etc. And while PowerPo...