 (No Ratings Yet)
We have already explored how you can animate any slide object, and then tweak the animation speed and animation events. Although you add animation to a chart in the same way, PowerPoint provides some extra animation options that are applicable only to charts. For example, you can animate series and categories individually as required — and you can also decide whether you want to animate the plot area or not. In this tutorial we’ll explore how to apply animation to chart and also explore the various Chart animation options in PowerPoint 2010.
Learn how to animate charts in PowerPoint 2010 for Windows.
Related Posts
 The Star Wars credits style is a variant of the Crawl animation. In this style, the text crawls from the bottom to the top, as it also does with Crawl...
 Do you need to keep track of the time you spend while delivering your slides? What if you are in a situation where you must give your presentation wit...
 Let's imagine you have a 3 minute video or audio clip. Exactly after the clip has played for a minute, you want some text to appear super-imposed abov...
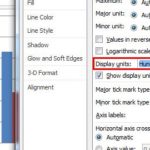 In your chart, Axis Labels are the labels for the Categories and Values on chart axes. So where do these labels come from? Category axis labels reflec...