 (No Ratings Yet)
Everything on a chart within PowerPoint 2013 is placed on top of the Chart Area — this essentially is the entire area that encompasses your chart. Thus, the Chart Area is that part of your chart which is placed beneath all other chart elements. By default, the Chart Area doesn’t possess any fill or any kind of formatting unless you have used a particular Chart Style. Even though this default status works well, you can opt to format as required. You can change the fill, border, and effect of the Chart Area, change the size and properties of the chart, and also change the font attribute.

Learn about the Chart Area in PowerPoint 2013 for Windows.
Related Posts
 The chart templates you save within PowerPoint 2013 are saved into a default folder location which you do not have to worry about, as far as you are u...
 You can tweak your chart in PowerPoint as much as you want so that the resulting chart follows your specifications. Once you met a standard that you m...
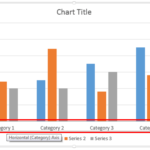 Even though charts are a visual medium, they still contain plenty of text in the form of data labels, titles, legend, axis labels, etc. Whenever you i...
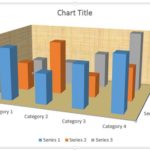 Unlike conventional 2D charts, 3D charts have distinct walls and a floor. Also, by default, these walls and floor show no fill and not even a border. ...