 (No Ratings Yet)
In a chart, the Plot Area is the layer placed between the Chart Area and other chart elements such as Data Series and Gridlines. This layer typically also has the axes on its perimeter. Typically the Plot Area looks as if it is merged into the Chart Area because it is often transparent, and you can see the Chart Area through it. So, you may not be able to distinguish it from the Chart Area. This default status works well. However, you can format the Plot Area separately to highlight it. You can change its appearance by applying fills, borders, and effects with just a few clicks.

Learn about the Plot Area for charts in PowerPoint 2013 for Windows.
Related Posts
 The chart templates you save within PowerPoint 2013 are saved into a default folder location which you do not have to worry about, as far as you are u...
 You can tweak your chart in PowerPoint as much as you want so that the resulting chart follows your specifications. Once you met a standard that you m...
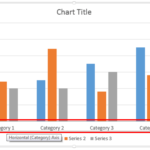 Even though charts are a visual medium, they still contain plenty of text in the form of data labels, titles, legend, axis labels, etc. Whenever you i...
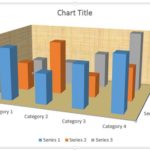 Unlike conventional 2D charts, 3D charts have distinct walls and a floor. Also, by default, these walls and floor show no fill and not even a border. ...