 (1 votes, average: 5.00 out of 5)
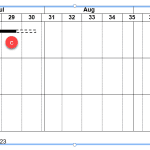
empower Charts is a PowerPoint add-in that simplifies the creation of a broad range of chart types, including bar charts, pie charts, and line graphs, while ensuring alignment with brand guidelines. In addition to standard charting capabilities, the tool supports project management visualizations such as Gantt charts. This feature allows users to build timeline-based graphics directly within PowerPoint, offering a practical alternative to external applications or manual formatting.

Learn how to create Gantt charts using empower in PowerPoint.
Related Posts
 Gantt charts are among the most useful visualizations you can use to show a process with concurrent tasks. Such tasks are not easy or even practical t...
 Data labels are indications used to quickly identify data series in a chart. There are some essential guidelines that relate to data labels. Data labe...
 Line charts can display continuous data over time, set against a common scale, and are therefore ideal for showing trends in data at equal intervals. ...
 So what's the difference between a Column Chart and a Bar Chart? Purists may call them both bar charts and some charting folks may also find many, man...