 (No Ratings Yet)
Gantt charts are among the most useful visualizations you can use to show a process with concurrent tasks. Such tasks are not easy or even practical to create within PowerPoint, and we did explore a proof-of-concept tutorial. Now, let us explore how think-cell, a well-known PowerPoint add-in can make this task simpler. With think-cell, it’s also easier to update Gantt charts as needed.

Learn how to create Gantt charts using think-cell in PowerPoint.
Related Posts
 Technically, yes, you can create a bar chart in PowerPoint and go through some hoops and workarounds to make it look like a Gantt chart. However, let’...
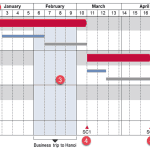 There are charts of all kinds that can be seen in business reports, presentation slides, website pages, books, and even on social media. However, the ...
 A stock chart is a price chart of a specific stock, plotted over a time frame. Stock charts created in PowerPoint can be both candle or stick charts, ...
 In a previous article, we looked at waterfall charts. A simple waterfall chart contains just one parameter, represented by one series in your data. Su...