 (1 votes, average: 5.00 out of 5)
In a previous article, we looked at waterfall charts. A simple waterfall chart contains just one parameter, represented by one series in your data. Such a chart is useful because it’s instantly intuitive, not to mention extremely powerful as a data visualization tool. Yes, stacked waterfall charts add a whole new dimension to data visualization. We will learn more about stacked waterfall charts and explore more example scenarios to understand where they are best used.

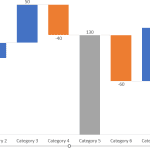
Learn more about stacked waterfall charts in PowerPoint.
Related Posts
 Waterfall charts do portray figures and numbers, but they also tell a story over a period. These stories relate to anything from inventories to staffi...
 Stacked Waterfall charts are a little different than conventional waterfall charts. Such charts can be easily created using the think-cell add-in for ...
 Waterfall charts may sound complicated, but they are among the easiest charts to understand. Just like a story that builds up layer by layer, the colu...
 Harvey balls are round ideograms or pictograms that show different states of a ball with quarters added or subtracted to attain five states between st...