 (1 votes, average: 5.00 out of 5)
Waterfall charts may sound complicated, but they are among the easiest charts to understand. Just like a story that builds up layer by layer, the columns in these charts guide us through rising and falling numbers. It’s almost as if you are on a journey, and by the time you reach your destination, you’ve understood the story hidden within the data.

Learn more about Waterfall charts in PowerPoint.
Related Posts
 Technically, yes, you can create a bar chart in PowerPoint and go through some hoops and workarounds to make it look like a Gantt chart. However, let’...
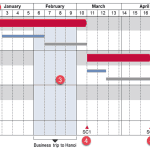 There are charts of all kinds that can be seen in business reports, presentation slides, website pages, books, and even on social media. However, the ...
 Stacked Waterfall charts are a little different than conventional waterfall charts. Such charts can be easily created using the think-cell add-in for ...
 In a previous article, we looked at waterfall charts. A simple waterfall chart contains just one parameter, represented by one series in your data. Su...