 (2 votes, average: 5.00 out of 5)
In an ideal world, we would like to have charts that had all positive values. Yet, sometimes, growth rates may plummet, and you might end up seeing negative values in your charts. Or sometimes, negative values may be something good that you need to highlight. In this tutorial, we teach you how you can highlight negative values in a chart by using the Invert if Negative option of a data series in within PowerPoint 2002 or 2003.

Highlight negative values in a chart in PowerPoint 2003 and 2002 for Windows.
Related Posts
 Have you seen charts that were not filled with solid color fills or geometric patterns, but rather with pictures? For instance, if you wanted to show ...
-
Working with charts in PowerPoint involves a deep knowledge -- hidden beneath the surface are umpteen options that many PowerPoint users are simply no...
-
You can create the most amazing charts without any text since the main purpose of any chart is to show a trend. Having said that, text plays a very im...
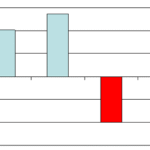 By default, PowerPoint 2002 and 2003 use white as the color of any negative series in your charts. This looks very unimaginative and there’s a workaro...