
Charts in PowerPoint comprise several elements that we call Chart Elements. Typical chart elements include series (and this could be one or more series with values), axes (horizontal, vertical, and in some cases a third axis as well), plot area (the active chart area), legend, chart title, and many more.

Learn about chart elements in PowerPoint 2007 for Windows.
Related Posts
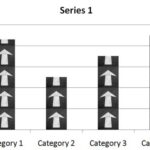 Did you happen to see a chart that spoke of fruit exports, and each column of the chart was filled with pictures of a particular fruit type rather tha...
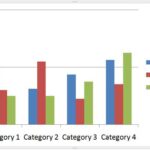 The significance of any chart lies in its ability to visually represent complex data as a trend that an audience can easily grasp. So, if you create a...
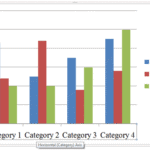 Although charts are a visual medium, they still contain plenty of text in the form of data labels, titles, legend, axis labels, etc. And while PowerPo...
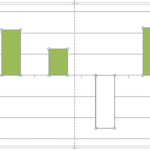 If your chart has negative values, then PowerPoint uses the same fill color for negative values in the sample chart. Fortunately, you can override thi...