 (No Ratings Yet)
In this series on using animation in PowerPoint 2011, you have already explored how you can apply animation to any slide object, and then tweak the animation speed and animation events. Charts can also be animated in a similar way — however PowerPoint provides some extra animation options that are applicable only to charts. For example, you can animate series and categories individually as required — and, you can also decide whether you want to animate the plot area or not. In this tutorial you’ll learn how to apply animation to chart and also explore the various chart animation options in PowerPoint 2011.

Learn how to animate charts in PowerPoint 2011 for Mac.
Related Posts
 The Star Wars-credits style is a kind of Crawl animation. In this style, the text crawls from the bottom to the top, as it also does with Crawl. Addit...
 Charts that include elements spaced apart look better. You can increase the Gap width so that there is enough space between the categories. Also, you ...
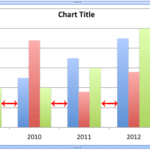 The Gap width within a chart is the space between two series points -- this by default is set to 150% of the width of individual Data Series (columns)...
 Patterns in PowerPoint are two-color designs that include lines, dots, dashes and checks. PowerPoint includes 48 such patterns with names such as 5%, ...