 (No Ratings Yet)
Making a chart look different involves so much because each chart has almost 10 or more elements that contribute to its appearance. If you start formatting all these 10 elements individually, it will take a long time to get results. And the same attributes will be difficult to apply to any other chart within the same presentation. The saviour in this case can be the amazing Chart Styles option in PowerPoint 2013. These Chart Styles include pre-defined combinations for various chart elements and include effects and layouts that can change the look of your chart completely. And all these styles are based on Office Themes. Just a couple of clicks can make your charts look distinctive.

Apply predefined Chart Styles to your charts in PowerPoint 2013 for Windows.
Related Posts
 The chart templates you save within PowerPoint 2013 are saved into a default folder location which you do not have to worry about, as far as you are u...
 You can tweak your chart in PowerPoint as much as you want so that the resulting chart follows your specifications. Once you met a standard that you m...
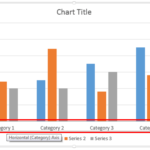 Even though charts are a visual medium, they still contain plenty of text in the form of data labels, titles, legend, axis labels, etc. Whenever you i...
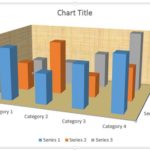 Unlike conventional 2D charts, 3D charts have distinct walls and a floor. Also, by default, these walls and floor show no fill and not even a border. ...