
By Kurt Dupont and Geetesh Bajaj
Making Fun Personalized Videos with PowerPoint—Super Easy!
How Did We Make This Cool Personalized Video?
Making Fun Personalized Videos with PowerPoint—Super Easy!
Hey there! Ever wanted to make a cool video that has someone’s name and special messages just for them? Guess what? You can do that in PowerPoint! Yup, the same thing you use for slideshows can also make awesome videos!
In this video and article, we’ll show you how to create personalized videos step by step using PowerPoint and a little help from DataPoint, an add-in for PowerPoint.
Imagine you’re the boss of a company, and you want to make special videos for your employees when it’s time for their big review (that’s when a boss tells them how they’re doing).
For this example, we made a fun video where we walk around the office, and questions pop up on the screen along with the results—just like magic! Each employee gets their own custom video, making them feel extra special.
Sounds cool? Let’s get started! 🎥✨
How Did We Make This Cool Personalized Video?
Great question! Want to know the secret? It’s actually super easy!
We used PowerPoint (yep, the same thing you use for office presentations and board meetings) to create a video that’s just for one special employee—like a surprise just for them!
Follow these steps to create customized videos in PowerPoint using Excel data:
- Make sure you have the DataPoint add-in for PowerPoint installed.
- Use data already available in an Excel sheet that you want to share with your employees. Our sample Excel sheet, shown in Figure 1, below contains all the 360-degree employee review feedback.

Figure 1: 360-degree employee review data in Excel- Create a new presentation in PowerPoint and insert a new video clip that covers the entire slide area, as shown in Figure 2, below. This video was sourced from Pexels.

Figure 2: Video inserted in PowerPoint- All right, we now need to connect our PowerPoint to an Excel spreadsheet (that’s like a giant table full of numbers and info you saw in Figure 1). This spreadsheet has all the employee review results, and we want PowerPoint to grab those results automatically. How do we do that? With a special tool called DataPoint.
- Think of DataPoint like a secret tunnel 🚇 between PowerPoint and Excel. It helps PowerPoint read the numbers from Excel and show them in our video—without us having to type them in one by one (because, ugh, who wants to do that?). Now, every time the review scores change in Excel, PowerPoint updates automatically. Pretty cool, huh? Let’s keep going!
- Now, make sure that your Excel sheet is saved and closed. Also, save your open PowerPoint presentation. Next, access the DataPoint tab of the Ribbon, as shown highlighted in green within Figure 3, below.

Figure 3: Click the List command- Now, click on the List command, as shown highlighted in red within Figure 3, above.
- In the ensuing Connections dialog box, locate the Available connections box, and choose Microsoft Excel, as shown highlighted in red within Figure 4, below. Then, click on the Add connection button, highlighted in green within Figure 4.

Figure 4: Connected to Microsoft Excel- You will see the Excel connection dialog box, shown in Figure 5, below. Click the Browse button, highlighted in red within Figure 5, and navigate to choose the Excel file. Then, click on the OK button, highlighted in blue within Figure 5.

Figure 5: Excel connection dialog box- DataPoint will now add a new Excel connection, as shown highlighted in red within Figure 6, below. By default, this is named as New Microsoft Excel connection. Select the connection, and click the Rename button, highlighted in blue within Figure 6.

Figure 6: Add and rename the Excel connection- You will now be able to overtype over the default name. We typed Employee review, as you can see highlighted in red within Figure 7, below. Next, click the Add query button, highlighted in blue within Figure 7.

Figure 7: Add a query- You will now see an option to add a new query, as shown in Figure 8, below. Essentially, you are telling DataPoint the exact location of the data in Excel that you want to use.

Figure 8: Query added- Details about this query are explained below:
- Sheet: This is the Excel sheet chosen as the source of your data. We have only one sheet in this Excel file, but if you had multiple sheets, you would choose one of them.
Range: By default, DataPoint chooses all selectable cells as the range, but you can modify as needed. We did modify this value.
The first row contains field names: Select this option as we have done.
Data refresh rate: This is set at 60 seconds by default. We are not changing this value. - Next, click the OK button, highlighted in blue within Figure 8, to proceed.
- You can now click on the Preview data checkbox, shown highlighted in red within Figure 9, below, to see the contents of the Excel sheet.
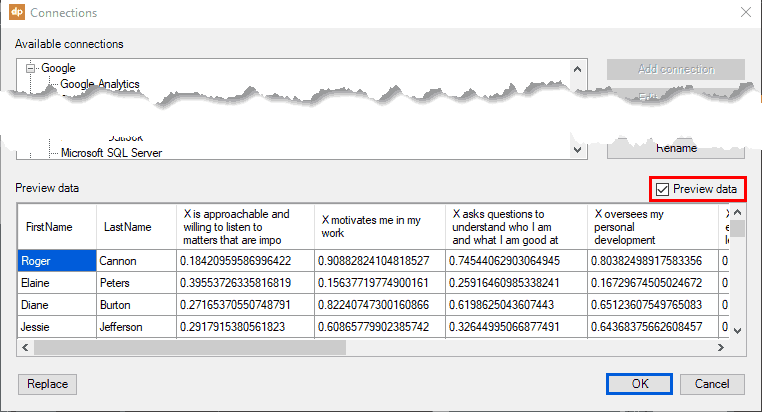
Figure 9: Preview data- Next, click the OK button, highlighted in blue within Figure 9, above.
- Now, here’s the fun part! We inserted text boxes in PowerPoint to show the important stuff—like the questions in a green-colored text box, as shown in Figure 10, below. We also added a yellow-colored text box for the employee’s score (in percentages, which is just a fancy way of showing numbers out of 100). There’s no text content in either box yet, since that will be sourced from our Excel sheet, shown earlier on this page in Figure 1. Do note that these text boxes are placed over the video clip we inserted in the preceding section.

Figure 10: Text boxes inserted as placeholders for data- Now, select a text box, as shown highlighted in red within Figure 11, below. Next, access the DataPoint tab of the Ribbon, as shown highlighted in green within Figure 11. Finally, click the Text box command, highlighted in blue within Figure 11.

Figure 11: Text button in the DataPoint tab- Doing so summons the Text box dialog box that you can see in Figure 12, below. Do note that the Data connection is already selected since this presentation has only one data connection. If there were more connections, you could select the connection you need in the Data connection drop-down list, highlighted in red within Figure 12.

Figure 12: Text box settings- You can also choose the Column drop-down list to choose the appropriate field. We chose FirstName, as shown highlighted in blue within Figure 12, above. We will not alter any other values for now, and will click on the OK button, highlighted in green within Figure 12.
- You will now see the topmost FirstName (Roger) in the text box, as can be seen in Figure 12, above. But what if you wanted to add more text content after FirstName?
- To do so, bring up the Text box dialog box again. This time, click the Texts tab, as shown highlighted in red within Figure 13, below.

Figure 13: Texts tab- Now, add the text that you want to add after the FirstName field in the Suffix box, highlighted in green within Figure 13, above. You can also add text that you want to place before the FirstName field in the Prefix box. When done, click the OK button, highlighted in blue within Figure 13.
- You can similarly add more text boxes as needed and populate them with dynamically linked text using DataPoint, as shown in Figure 14, below. But wait! Won’t all those text boxes get messy? Nope! Here’s a trick: They can overlap!

Figure 14: Add more text boxes- Instead of showing everything at once (which would look crazy 🤯), we make each text box appear for a few seconds and then—poof!—it disappears when the next one shows up. Just like magic with a lot of help from PowerPoint’s entrance and exit animations! 🎩✨
- This way, everything looks super smooth and easy to read. Cool, right? Now let’s keep going!
- Now that PowerPoint and Excel are best friends, it’s time to turn everything into a personalized video! We use something called the DataPoint snapshot feature (sounds fancy, but it’s super easy!). This tool takes a snapshot of all the information for each employee and saves it, so we can make a special video just for them. It’s like taking a selfie 🤳 but for data! 📊✨
- To proceed, access the DataPoint tab of the Ribbon again, and click the Snapshot Save As button, highlighted in red within Figure 15, below.

Figure 15: Snapshot Save As option- Doing so brings up the Snapshot Save As dialog box that you can see in Figure 16, below.

Figure 16: Snapshot Save As dialog box- Column for Filename: This drop-down list contains all the fields in the linked Excel file. We are happy with the FirstName option, as shown highlighted in red within Figure 16, above.
- Target Folder: Click the Browse button, highlighted in blue within Figure 16, and choose a location for saved Snapshot files.
- File format: You can choose from several file formats including PowerPoint PPTX files, but since we want to create videos, we chose the MP4 Video option, highlighted in green within Figure 16.
- There are many more settings, but this is all we need for now. So, we clicked on the OK button, highlighted in purple within Figure 16.
- DataPoint will now warn you that it’s now going to render individual files, which can be PPTX presentations, PDFs, or even videos, as we opted for. You can see this warning box in Figure 17, below. This process can take a while, especially if you had plenty of data to start with. For now, click the OK button.

Figure 17: DataPoint warning boxStandard vs. Enterprise
Some options such as the option to export videos are available only in the Enterprise version of DataPoint.
- Once you click OK, PowerPoint puts everything together—names, scores, and questions—and boom! You end up with custom videos made for all your employees!
What is DataPoint?
DataPoint is an add-in for Microsoft PowerPoint that lets you connect your slides to various data sources, enabling real-time data updates within presentations. With DataPoint, you can link slides to databases, Excel files, web feeds, and more, so your content refreshes automatically as the data changes.
This tool is often used to create live dashboards, digital signage, or information screens where up-to-date data is critical, such as in corporate presentations, news boards, or display screens in lobbies and offices. A 7-day trial of DataPoint is available.
So, as you can see PowerPoint and DataPoint together make an amazing team. A task which may have taken all day can be completed quickly. Even better, this task is saved as part of your PowerPoint file, so you can always come back, make changes, and export newer presentations or videos without having to start all over again.

Kurt Dupont is a solution provider who would go out of his way just to ensure he brings out the best when it comes to issues that have to deal with data-driven presentations, data visualization, and digital signage software.
He started by working at airports worldwide to set up airport databases and flight information screens. This evolved to become the basis for PresentationPoint.
The views and opinions expressed in this blog post or content are those of the authors or the interviewees and do not necessarily reflect the official policy or position of any other agency, organization, employer, or company.
Related Posts
 By Kurt Dupont and Geetesh BajajWith DataPoint, you can add new features to Microsoft PowerPoint for creating data-driven presentations. This lets you...
 By Kurt Dupont and Geetesh BajajIn a data-driven world, staying current is key—but sometimes you need a fixed record. With PowerPoint's DataPoint add-...
 By Kurt DupontReady to level up your data game? In today’s business world, you need more than just rows and columns—you need to turn raw data into sma...
 By Kurt DupontDigital signage is taking over almost every industry, and the automobile business is no exception. Today, we’re diving into how digital ...