
This is the print version of this page. All content is copyright Indezine.com 2000-2026.
Thoughts and impressions of happenings in the world of PowerPoint and presentations, continuously updated since 2003.
See Also:
PowerPoint and Presenting Notes
PowerPoint and Presenting Glossary
We already explored how Haiku Deck now plugs right within SlideShare and allows you to create slides. In this post, we will explore the Haiku Deck interface within SlideShare, as shown in Figure 1, below.
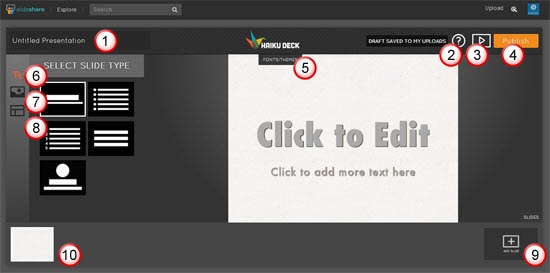
Figure 1: The Haiku Deck interface
The interface is explained, as marked in Figure 1, above:
Filed Under:
Companion Programs
Tagged as: Haiku Deck, Online Presentations, PowerPoint, SlideShare
Comments Off on Haiku Deck Interface within SlideShare
In a PowerPoint column chart, Axes are typically positioned on the left and bottom of the Plot Area. However, there may be scenarios where your chart axes cross each other within the Plot Area rather than be located on its edges. Attaining such a crossed axes can be desirable due to a variety of reasons in both the Value and Category axes.

Learn how to add and alter the position of crossed axes in PowerPoint 2013 for Windows.
Filed Under:
PowerPoint 2013
Tagged as: Charting, Design, PowerPoint 2013, Tutorials
Comments Off on Learn PowerPoint 2013 for Windows: Crossed Axes for Charts
For many slides, you may want to create custom graphics that include a human head. Here are some female head silhouette graphics for PowerPoint – these are perfect for the presentation slides that relate to thought processes, visualization, sociology, psychology, communications, and more. We provide you with 4 typical graphics in a silhouette style. To these head graphics, just add any other icon style graphics to end up with something that explains a concept — examples include gears, atoms, bulbs, jigsaws, mazes, etc.

Download and use these graphics in your slides.
Filed Under:
Clip Media
Tagged as: Clip Media, Design, Graphics, PowerPoint
Comments Off on Female Head Silhouettes for PowerPoint – 01
This week we bring you exclusive conversations with Arpit Dhariwal of SlideShare and Motti Nisani of emaze. We also explore how you can use Haiku Deck within SlideShare to create your own presentations. PowerPoint 2013 users can learn more from a bunch of tutorials on Chart Axes.
And don’t miss the new discussions and templates of this week!

Read Indezine’s PowerPoint and Presenting News.
Filed Under:
Ezine
Tagged as: Ezine, Indezine, News, PowerPoint
Comments Off on PowerPoint and Presenting News: December 2, 2014
Sometimes your data type may require a second axis. The sample data that we took for this tutorial pertains to the average temperature and rainfall in London across the 12 calendar months of a year. The temperature is depicted in Celsius and the rainfall is in millimeters. What you should note carefully is that the value range of temperature spans between 30 and 70, whereas the range for rainfall is in between 0 to 12 (approximately). A chart that results from this data doesn’t live up to the comparison since we are trying to compare items that are from different data ranges.

Learn how to add a Secondary Value axis to charts in PowerPoint 2013 for Windows.
Filed Under:
PowerPoint 2013
Tagged as: Charting, Design, PowerPoint 2013, Tutorials
Comments Off on Learn PowerPoint 2013 for Windows: Add Secondary Value Axis to Charts
Microsoft and the Office logo are trademarks or registered trademarks of Microsoft Corporation in the United States and/or other countries.