![]()
This is the print version of this page. All content is copyright Indezine.com 2000-2026.
![]()
Thoughts and impressions of happenings in the world of PowerPoint and presentations, continuously updated since 2003.
See Also:
PowerPoint and Presenting Notes
PowerPoint and Presenting Glossary
The Plot Area of a chart, which is transparent by default, can be enhanced with various fill types. But you should exercise some caution — a busy Plot Area will subdue the actual chart! This can be avoided by taking a little precaution while choosing the fill type and also when you apply it. In this tutorial, we will explore texture fills.

Learn how to apply texture fills to the Plot Area of a chart in PowerPoint 2013 for Windows.
Filed Under:
PowerPoint 2013
Tagged as: Charting, Fills, PowerPoint 2013, Tutorials
Comments Off on Learn PowerPoint 2013 for Windows: Apply Texture Fills to Plot Area of Charts
Picture fills can look great and distracting depending upon the type of picture you chose — and the object that you fill with the picture can also make a difference. If you need to use a picture as a fill for your chart’s Plot Area, then you must put in plenty of thought because you don’t want to crowd your chart. Therefore you can use a picture, but it’s best to use one that’s muted enough and does not attract too much attention.
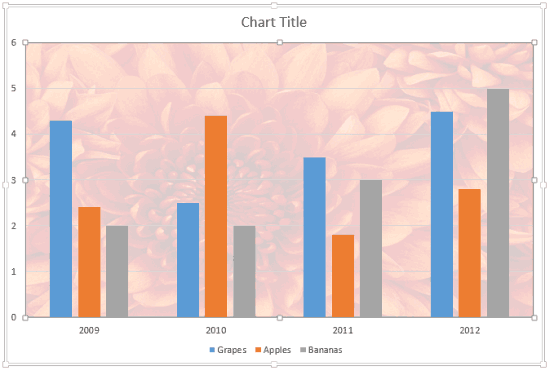
Learn how to apply picture fills to the Plot Area of a chart in PowerPoint 2013 for Windows.
Filed Under:
PowerPoint 2013
Tagged as: Charting, Fills, PowerPoint 2013, Tutorials
Comments Off on Learn PowerPoint 2013 for Windows: Apply Picture Fills to Plot Area
PowerPoint provides an option to fill any shape with a solid fill color easily. But what if you want a specific color to be filled? Maybe you need to use specific colors that are part of your company’s corporate identity. In that case, you will need to get an RGB value of that color. So what is RGB? RGB stands for Red, Green, and Blue, and each of these three colors possesses a value within the RGB color model. Let’s now imagine that you have a particular RGB value that you want to use as a fill for any shape; follow the steps below to learn how to add a rectangle of the color.

Learn about how to work with RGB Colors in PowerPoint 2011 for Mac.
Filed Under:
PowerPoint 2011
Tagged as: Color, Office for Mac, PowerPoint 2011, Tutorials
These combine-and-use stars symbols are already colored using popular colors – and since they are native PowerPoint objects, you can change their fills, lines, and effects. These stars are contained within a sample presentation you can download. Just copy the star clip art(s) you like and paste into another PowerPoint slide, or even a Word document or Excel worksheet.

Download and use these star shapes.
Filed Under:
Clip Media
Tagged as: Clip Media, Graphics, PowerPoint
Comments Off on PowerPoint Shapes: Stars 01
Gradient fills are typically blended fills between two or more colors that graduate from one color to another — and if you use neutral or muted colors, then a gradient fill can provide a great, understated backdrop for your chart. In this tutorial, let us learn how to apply a gradient fill to the Plot Area of a chart.

Learn how to apply gradient fills to the Plot Area of a chart in PowerPoint 2013 for Windows.
Filed Under:
PowerPoint 2013
Tagged as: Charting, Fills, PowerPoint 2013, Tutorials
Comments Off on Learn PowerPoint 2013 for Windows: Apply Gradient Fills to Plot Area of Charts
Microsoft and the Office logo are trademarks or registered trademarks of Microsoft Corporation in the United States and/or other countries.