![]()
This is the print version of this page. All content is copyright Indezine.com 2000-2026.
![]()
Thoughts and impressions of happenings in the world of PowerPoint and presentations, continuously updated since 2003.
See Also:
PowerPoint and Presenting Notes
PowerPoint and Presenting Glossary
If you want to insert a video clip within your PowerPoint slide, spare a thought for why you would insert video clips in the first place. Most of the video clips are just added to grab attention. Fortunately, there are a few good reasons to adding video clips — let us explore these, and then show you how you can add a video clip to your slide in PowerPoint 2013. Here are the good reasons.>
 Clips")
Learn how to insert a video or movie clip in PowerPoint 2013 for Windows.
Filed Under:
PowerPoint 2013
Tagged as: PowerPoint 2013, Tutorials, Video
Comments Off on Learn PowerPoint 2013 for Windows: Insert Video (Movie) Clips
In PowerPoint, you can always fill your chart’s data Series with a picture of your choice. However, the problem with this approach is that your picture will be squeezed in different ratios to fit into the Data Series. This discrepancy causes the columns to have squeezed fills, and that’s something that really does not get a higher aesthetic rating! There is a way to solve this issue, especially if your Column chart includes only one Data Series.
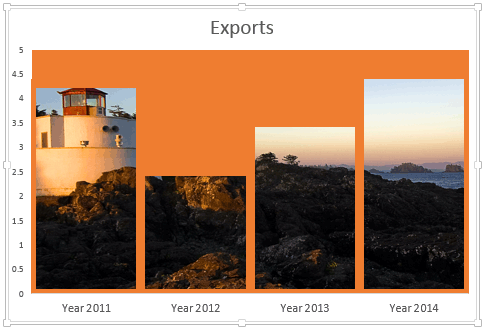
Learn how to make your chart columns to show the background fill in PowerPoint.
Filed Under:
PowerPoint All Versions
Tagged as: Charting, PowerPoint, Tutorials
Comments Off on Column Charts with Background Fill
When two or more people are involved in designing a presentation, there needs to be a channel for feedback. The Comments option works great for this purpose since it allows feedback without actually editing the slides themselves. A comment is a note that can be attached to any slide object or to a whole slide. You can add comments to write important notes for particular slide objects or for the slides themselves. This is a great way to provide feedback. Once a comment is added, you can edit the comment.

Learn how to add, edit, or delete Comments in PowerPoint 2010 for Windows.
Filed Under:
PowerPoint 2010
Tagged as: PowerPoint 2010, Tutorials
Comments Off on Learn PowerPoint 2010 for Windows: Add, Edit, or Delete Comments
A Data Table in a chart is a tabular representation of chart data that’s placed along with the chart itself. Just adding a Data Table essentially shows the table in the default formatting, and that may work most of the time. If it doesn’t, you may want to explore some advanced options that let you format your Data Table exactly as you want. This may help you to highlight the text or grid lines so that you can make the Data Table stand out.

Filed Under:
PowerPoint 2013
Tagged as: Charting, PowerPoint 2013, Text, Tutorials
Comments Off on Learn PowerPoint 2013 for Windows: Chart Data Table Options
Color is something that we can all differentiate between. Most of us have little problem differentiating between red and blue, or even between red and pink. Color is also something that’s been part of our lives, and part of our education system. Most of us learned about color before we learned the alphabet. Yet, as we grew, many of us forgot what a joy color can be!

Learn about various color models.
Filed Under:
Color
Tagged as: Color, PowerPoint, Tutorials
Comments Off on Color: Models
Microsoft and the Office logo are trademarks or registered trademarks of Microsoft Corporation in the United States and/or other countries.