
 (4 votes, average: 3.00 out of 5)
You all have heard about Nancy Duarte, a dear friend who is the CEO at Duarte, a presentation and storytelling company based in Sunnyvale, California.
Duarte put up some amazing tutorial videos recently that talk about some key presentation design principles. In my opinion, anyone who creates or works with presentations can benefit immensely from the foundation principles explained in these videos. In today’s post, we will explore one such video that looks at how you can set up an effective Grid system to work with your slides in PowerPoint.
As you saw in the video, the design folks at Duarte do not use the Grid or the Guides features available within PowerPoint. They actually create their own Grid by drawing lines within PowerPoint.

I spoke to Zaki Hussain, Senior Marketing Manager at Duarte and asked him what motivated the team at Duarte to create such videos?
He responded: “These videos help non-designers establish a level of design consistency to their template to create an on-brand presentation.”

Zaki Hussain is a Senior Marketing Manager at Duarte. Duarte helps people and brands communicate persuasive ideas. Since 1988, Duarte has advised 25 of the top 35 global brands on creative presentations. Through public and corporate workshops, Duarte Academy has trained tens of thousands of professionals to become better communicators, storytellers, and persuasive presenters.
The views and opinions expressed in this blog post or content are those of the authors or the interviewees and do not necessarily reflect the official policy or position of any other agency, organization, employer, or company.
Related Posts
 Mastering alignment is one of the simplest ways to elevate the professionalism of your PowerPoint slides, and Snap to Grid is a feature designed preci...
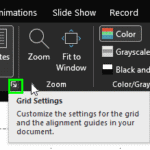 Once you turn on Gridlines in PowerPoint, you might think they are nothing more than a set of faint lines spread across your slide. It’s almost like g...
 PowerPoint's Gridlines help you position slide objects with greater precision. When used together with Rulers and Guides, Gridlines make it easier to ...
 You may be certain that PowerPoint is installed on your computer, yet when you double-click a PowerPoint file, it either fails to open in PowerPoint o...